YMatrix
Quick Start
Connecting
Benchmarks
Deployment
Data Usage
Manage Clusters
Upgrade
Global Maintenance
Expansion
Monitoring
Security
Best Practice
Technical Principles
Data Type
Storage Engine
Execution Engine
Streaming Engine(Domino)
MARS3 Index
Extension
Advanced Features
Advanced Query
Resource Groups
Federal Query
Grafana
Backup and Restore
Disaster Recovery
Guide
Performance Tuning
Troubleshooting
Tools
Configuration Parameters
SQL Reference
This document details the integrated installation of Prometheus and Grafana for YMatrix.
The monitoring bundle depends on the rsync utility. Ensure it is installed:
yum install -y rsyncmxadmin Has sudo Privilegesgrep -E 'mxadmin\s+ALL=$ALL$\s+NOPASSWD:\s+ALL' /etc/sudoers /etc/sudoers.d/*cd /software
unzip monitor_amd64_V1.1.zipNote!
You must use the V1.1 unified installation package.
Older versions used.rpmpackages for Grafana; the new version uniformly uses.tar.gzpackages. Using an.rpmpackage will causemxtool init monitorto fail.
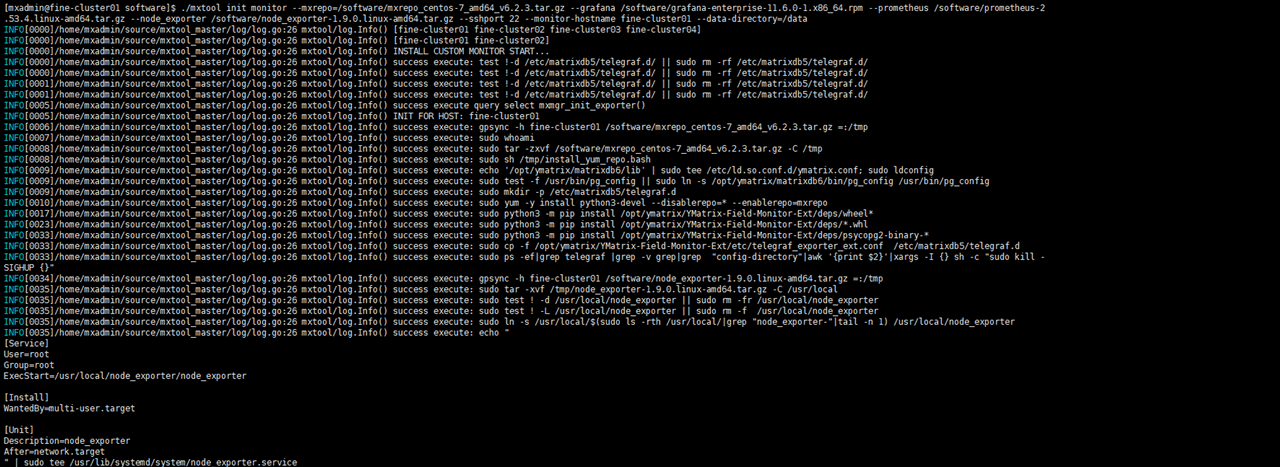
mxtool is a wrapper script that prints and executes underlying commands sequentially. If any step fails, you can manually log in to the target host to reproduce and troubleshoot.
Note!
Replace paths to installation packages with your actual file locations.
mxtool init monitor \
  --mxrepo=/software/mxrepo_centos-7_amd64_v6.2.3.tar.gz \
  --grafana=/software/grafana-enterprise-12.0.1.linux-amd64.tar.gz \
  --prometheus=/software/prometheus-3.4.1.linux-amd64.tar.gz \
  --node_exporter=/software/node_exporter-1.9.1.linux-amd64.tar.gz \
  --sshport=22 \
  --monitor-hostname=fine-cluster01 \
  --data-directory=/data \
--cluster-name=cluster1| Parameter | Description |
|---|---|
--data-directory |
Root directory for monitoring data storage (e.g., Prometheus, Grafana). |
--monitor-hostname |
Hostname where Grafana and Prometheus are deployed. |
--sshport |
SSH port for cluster nodes (default: 22). |
--cluster-name |
Logical name of the YMatrix cluster, used in metric labels and dashboard naming. |
curl http://127.0.0.1:9273/metrics | grep net_dev
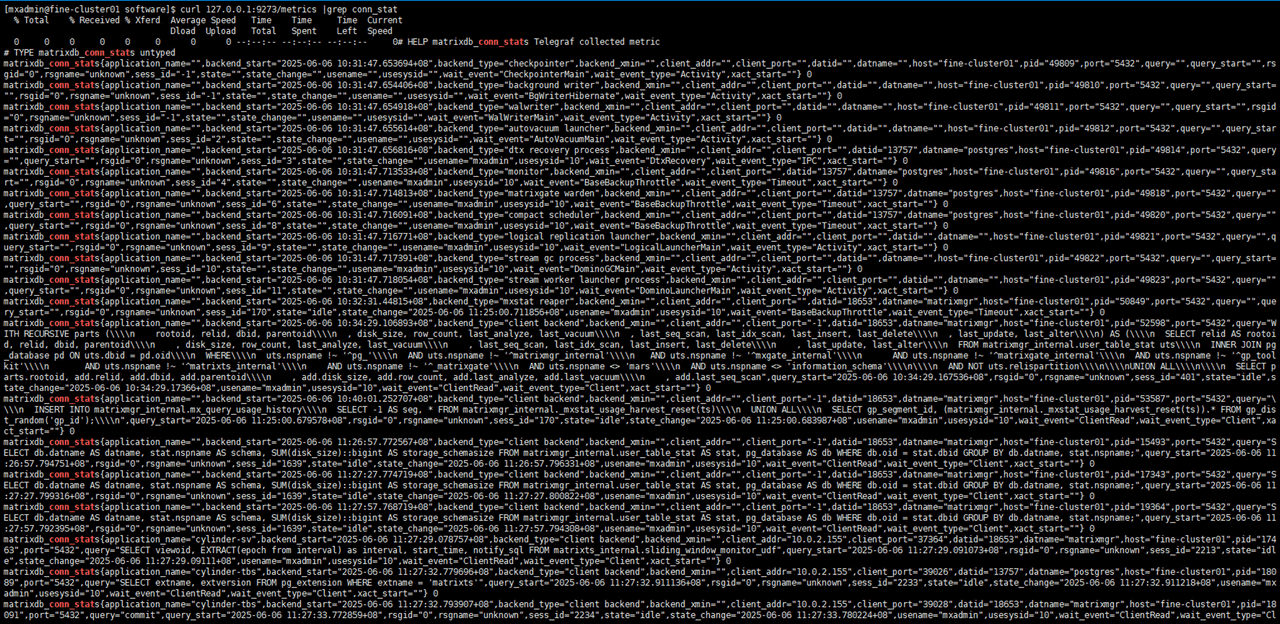
curl http://127.0.0.1:9273/metrics | grep conn_stat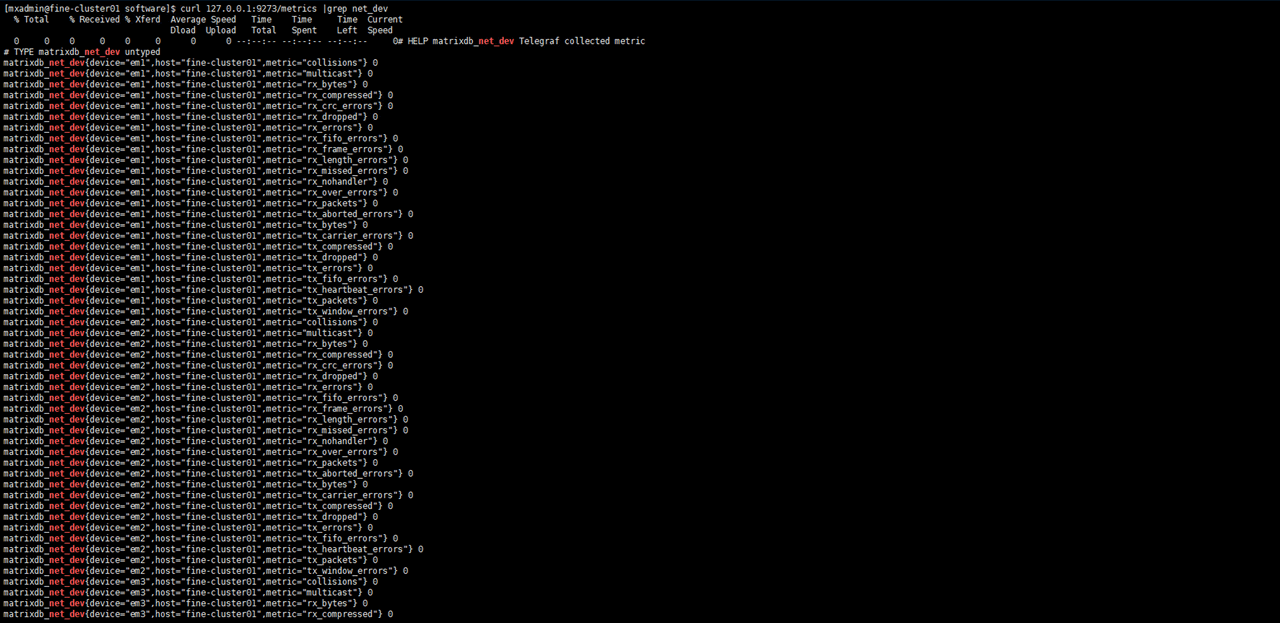
Access Prometheus at (replace <IP> with the actual IP address of monitor-hostname):
http://<IP>:9090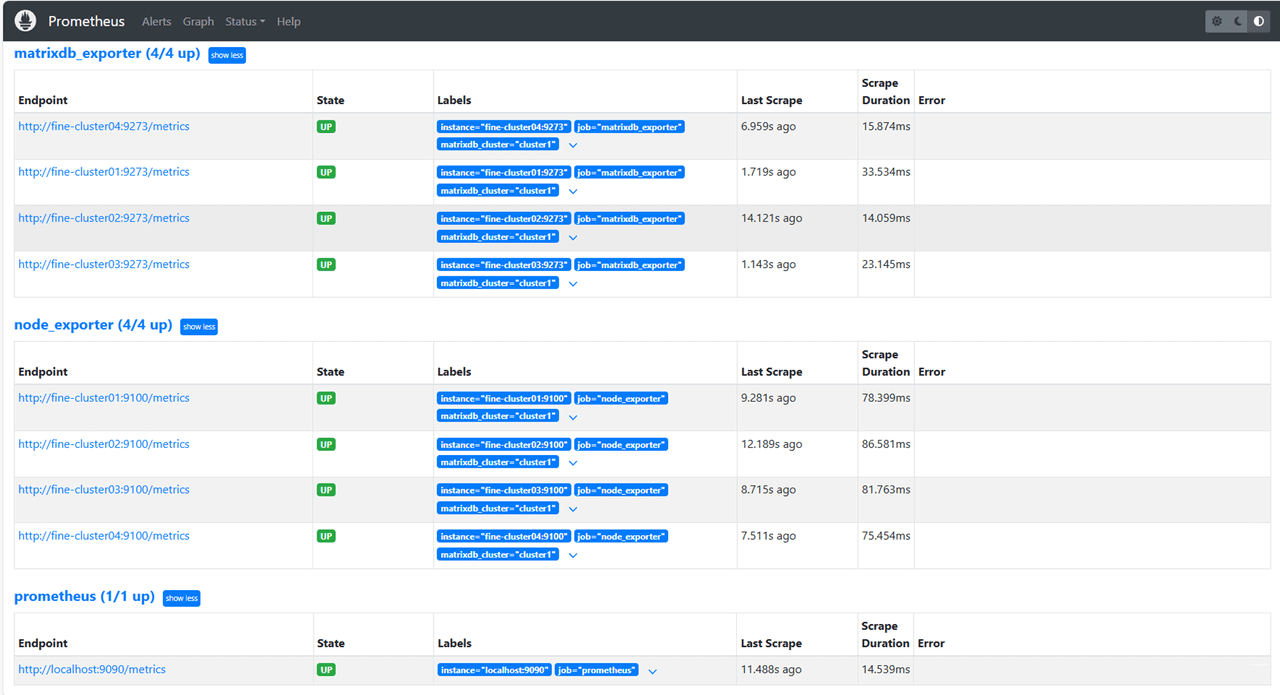
http://<IP>:3000Dashboard files are located inside the extracted mxrepo package at:
YMatrix-Field-Monitor-Ext/etc/dashboard/YMatrix Monitor ext_*.json
For detailed configuration guidance, see: Grafana Cluster Monitoring